- 31 Oct 2024
- 2 Minutes to read
Allocations & earnings
- Updated on 31 Oct 2024
- 2 Minutes to read
You can check your current allocations and performance fees achieved, along with additional information in your payments section.
Allocations

Capital under management
Current amount of funds that are invested in your DARWIN.
P&L total
Overall profit or loss achieved by your DARWIN with the capital under management allocated to it.
HWM
The high-water mark, or HWM, is a widely used concept in the assets management industry as a reference for the fees that managers should receive.
Using this method we ensure that they only receive fees for the profits they have actually generated and that this does not overlap with profits from previous time periods.
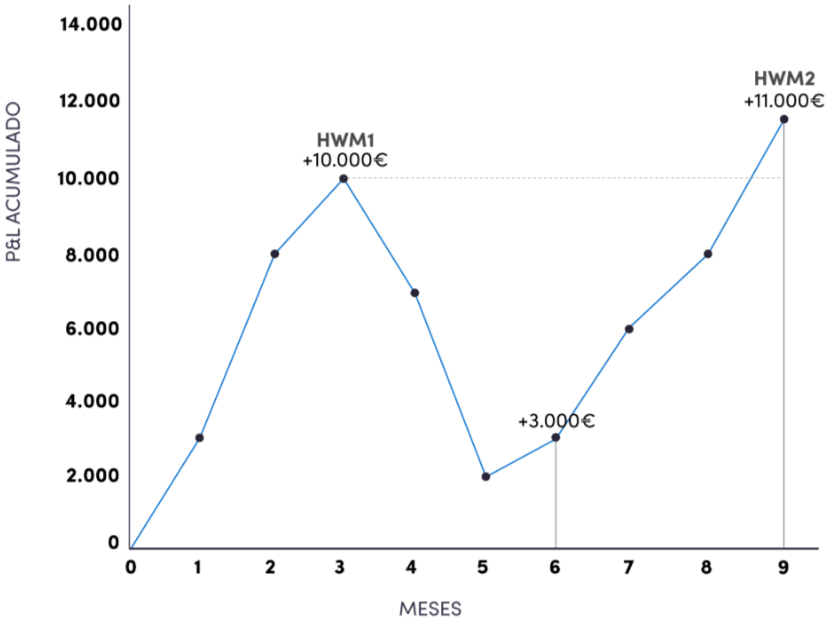
Let's look at an example of a graph showing the progress of a DARWIN's quote. For the sake of the example, let's imagine that the investor has remained invested for 3 quarters:

In the graph, we can see how the HWM is calculated as the months go by.
In the third month, the HWM1 is calculated for the profit generated in this quarter. In this case, $10,000 of profit would have been made (and, consequently, $1,500 of performance fees would be paid).
In the following quarter, no new HWM would be generated, since €7,000 would have been lost in this quarter and the start-up profit would have been reduced to €3,000. However, at the end of the third quarter, HWM1 is exceeded again by €1,000, so a new high water mark is established: HWM2. Performance fees would thus be paid for the difference between HWM2 (€11,000) and HWM1 (€10,000), i.e. €1,000 in additional profit and €150 in performance fees.
HWM Status
This is the distance in percentage between the DARWIN's current quote given the current allocation from the last HWM stablished.
If it's positive, it means you would be receiving performance fees given the current DARWIN's quote.
On the contrary, if it's a negative percentage, it tells how much return is needed in order to generate performance fees.
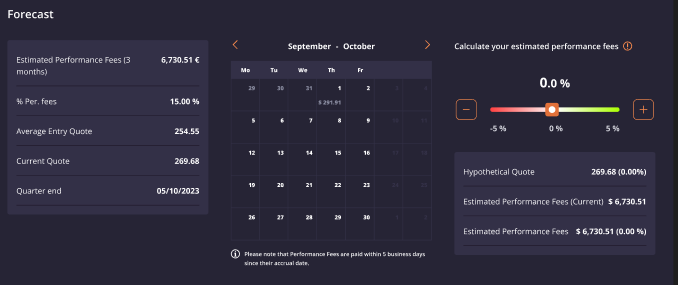
Forecast
You can estimate how much performance fees you can receive by modifying the return of your DARWIN, and consult the date(s) of the next performance fee calculation in the calendar.

Historical
The historical window shows the information about total performance fees earned, the top ranking position achieved in DarwinIA SILVER and GOLD, and a chart showing performance fees achieved by month.

Earnings
The earnings section shows information about performance fees you have earned in addition to information about your withdrawals, detailing every withdrawal of performance fees.


