How to analyze Assets & Timeframes
- 31 Mar 2023
- 1 Minute to read
How to analyze Assets & Timeframes
- Updated on 31 Mar 2023
- 1 Minute to read
Article summary
Did you find this summary helpful?
Thank you for your feedback!
Asset & Timeframes tab shows different information about the DARWIN in relation to assets allocation, trading time distribution and return distribution by day of the week.
Asset allocation
This section shows a pie chart where you can see the percentage of trades you have made in each different asset. You can view the information both by asset and by asset family (forex, commodities, indices, stocks or ETFs).
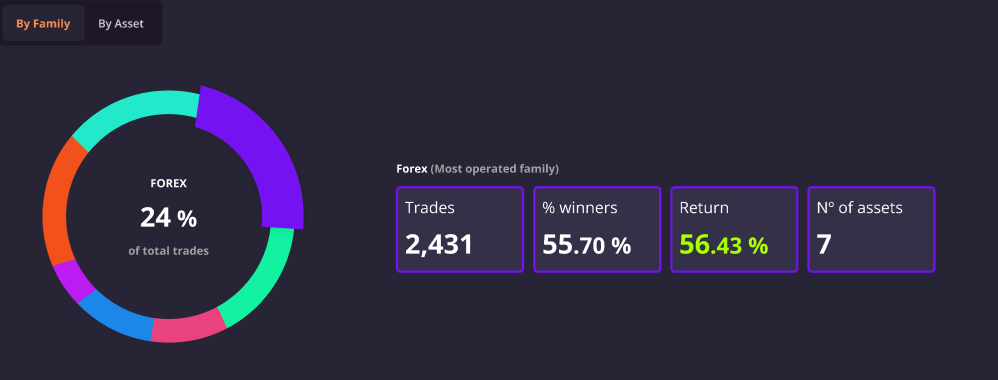
Additionally, you will find information about how many trades have been executed, the percentage of winning trades, and the return accumulated per asset.
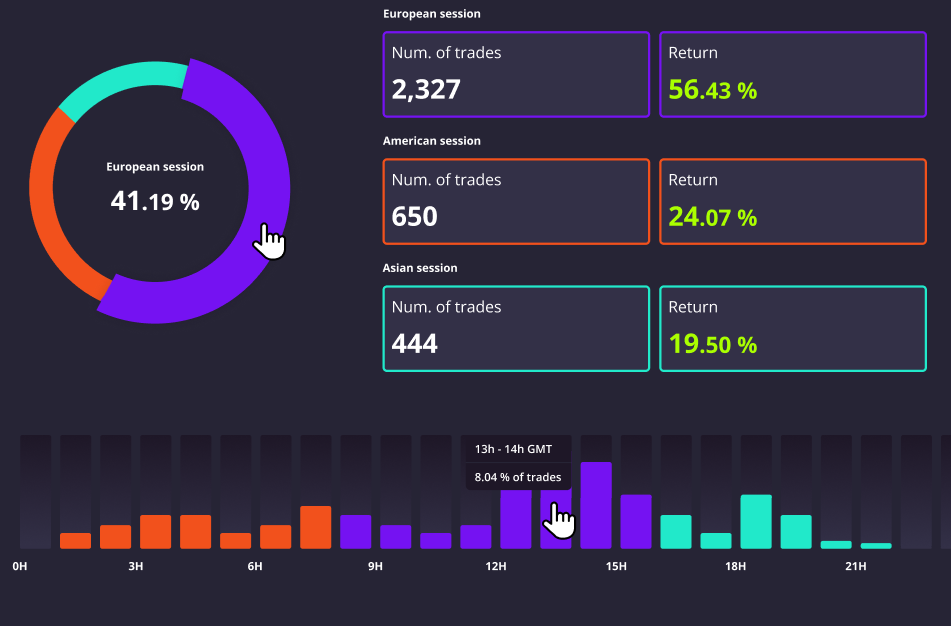
Trading time distribution
In this section you can see a similar pie chart where you can review the time distribution of your trades between asian (00:00-09:00 GMT), european (09:00-16:00 GMT) and american (16:00-00:00 GMT) sessions, as well as analyze the number of trades in each session and the accumulated return in each one of them.
Return distribution by day of the week
The chart shows the accumulated return generated by the DARWIN in each week’s day, separately. Bellow, the number of days with trading activity for each of the week’s days.
Analyzing the information
The content displayed in this section provide useful information to evaluate which assets and timeframes have been more profitable in your strategy.
Was this article helpful?