How to analyze correlation
- 14 Sep 2023
- 1 Minute to read
How to analyze correlation
- Updated on 14 Sep 2023
- 1 Minute to read
Article summary
Did you find this summary helpful?
Thank you for your feedback!
What is correlation?
Correlation in Darwinex Zero measures the degree to which two DARWINs' returns move in relation to each other.
Do they move in a similar fashion, or are they completely different?
This information is very important when it comes to creating a portfolio of DARWIN because, if the DARWINs are highly correlated, not only are we not diversifying but in effect, it would be the same as investing all our capital in just one DARWIN.
The results of a correlation coefficient are measured between +1 and -1.
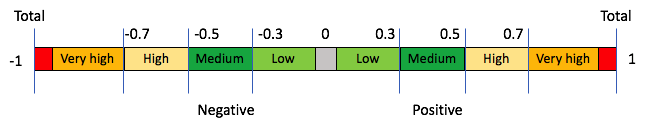
- A value of 0 implies a complete decorrelation. Their returns move independently from one another.
- A value of 1 implies the maximum correlation, or perfect positive correlation. When one of their quote prices rises, the other will also rise by the same proportion.
- A value of -1 implies the maximum inverse correlation or a perfect negative correlation. This means that when one of the DARWINs increases its quote price, the other will decrease by the same proportion.
- Values beyond +0.7 or -0.7 are considered highly correlated.
How it is measured?
We use the standard correlation formula taking into account last 3 months.
Correlation will be measured only for DARWIN with a minimum rating of 60. It will not be measured for DARWINs with a lower rating.
Correlation comparison
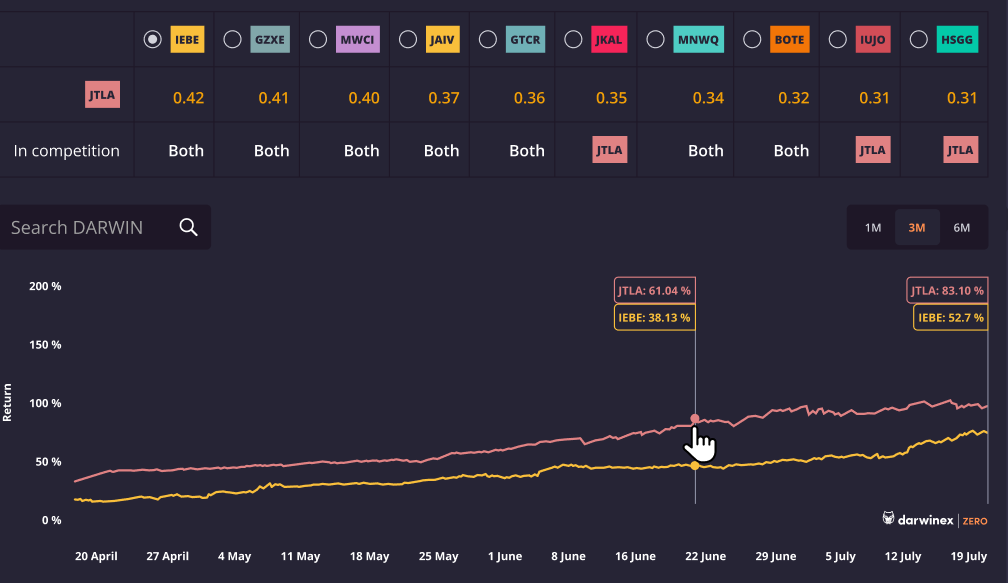
In the correlation tab of your DARWIN, you will be able to compare your DARWIN's performance against other DARWINs.
In the first table, there is a list of the DARWINs most correlated with your own. If you click on any of these DARWINs, a graphe of both DARWINs return chart will be displayed below for the selected timeframe.
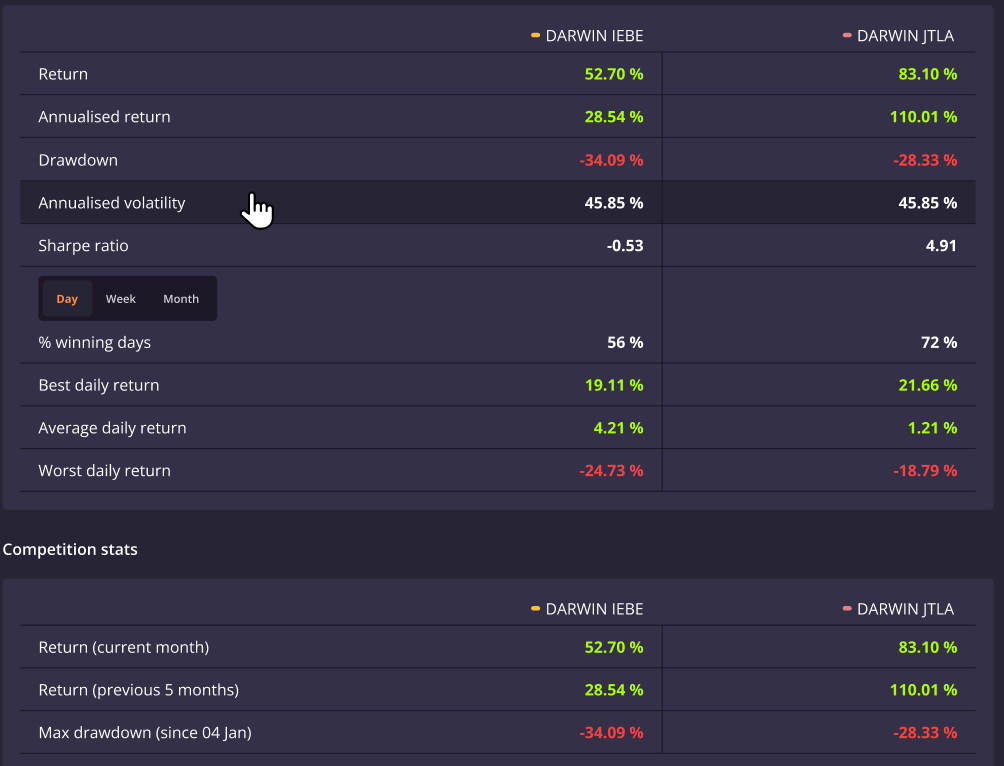
Additionally all the most relevant statistics are compared in the table below the graph:
Was this article helpful?