D-Leverage
D-leverage is the proprietary tool we use at Darwinex Zero that measures the risk of a trading decision.
Introduction
Nominal leverage & risk...
The most common way of measuring the risk of a trade is through its nominal leverage.
This is done by dividing the nominal volume of a trade by the account's equity. Thus, a trade with a leverage of 5:1 is equivalent to opening a volume 5 times superior to said account's equity.
Therefore, we can reach the conclusion that the greater the leverage, the greater the risk, right?
The answer is only a partial yes, because this leverage/risk focus does not take into account one fundamental factor when it comes to evaluating the risk of an asset: its volatility:
...and volatility
At the risk of oversimplifying, it is not the same thing to have a trade, with a nominal leverage of 5:1 on the EURUSD, as one with the same leverage on the GBPJPY, as this last trade would tend to be a lot more volatile than the first one.
Consequently, the greater the volatility, the greater the risk, because the asset quote price can move further in a unit of time, and ''more things could happen''.
D-Leverage and position risk
Darwinex Zero has its own way of measuring the risk per position (not per trade), and we call this D-Leverage (understand the difference between a position and trade).
D-Leverage into account the following variables:
- Nominal Levarage of each one of the trades opened simultaneously.
- Asset's volatility - or the combination of assets that make up such position.
- Correlation => we measure the correlation of all the assets opened simultaneously which constitute the trading position. The greater the correlation, the greater the risk, and viceversa.
- Duration => Compares the volatility in terms of the EURUSD for that time period.
The final result is standardized in terms of the EURUSD. Therefore, a position with a D-Leverage of 3, would be the same as opening a trade on the EURUSD with a nominal leverage of 3.
This way of measuring the risk of any position, taking as a reference the EURUSD, is called the D-Leverage.
Thanks to the D-Leverage, you will be able to compare the risk of all your trading positions regardless of the assets it includes, the type of strategy, etc.
What would be the D-Leverage of our previous example with the pairs EURUSD and GBPJPY?
Remember that the nominal leverage of each position was.
- EURUSD 5:1
- GBPJPY 5:1
If the volatility of the GBPJPY were 20% higher than the EURUSD, the D-Leverage would be:
- EURUSD 5:1
- GBPJPY 6:1
The leverage adjusted to the volatility, or the D-Leverage for the GBPJPY, would be 20% higher than the EURUSD (6 to 1).
Again, using D-Leverage, you will be able to compare both risks and reach the conclusion that GBPJPY presents more risk than EURUSD should both have the same nominal leverage.
D-Leverage Case study
In this example, we are going to show you how D-Leverage evolves in the following three positions.
Imagine that:
- You go long on the USDCAD with a nominal leverage of 7:1.
- Before closing the trade, you go short on the GBPJPY with a nominal leverage of 5:1.
- You close the USDCAD.
- A bit later you decide to close the GBPJPY.

During this time period, you can see 3 distinct phases:
- Position nº1 => made up of a long trade on the USDCAD 7:1
- Position nº2 => consists of two trades: long on the USDCAD 7:1 and short on the GBPJPY 5:1
- Position nº3 => made up by a short trade on the GBPJPY 5:1
How is the D-Leverage calculated?
(Bear in mind that, for a time, trades with different nominal leverage and volatility coincide.)
Let's suppose that, when you open the trades, the volatility of these two pairs in relation to the EURUSD is the following:
- EURUSD is 40% more volatile than the USDCAD
- GBPJPY is 20% more volatile than the EURUSD
You can see on the graph how the 3 positions progress across time:
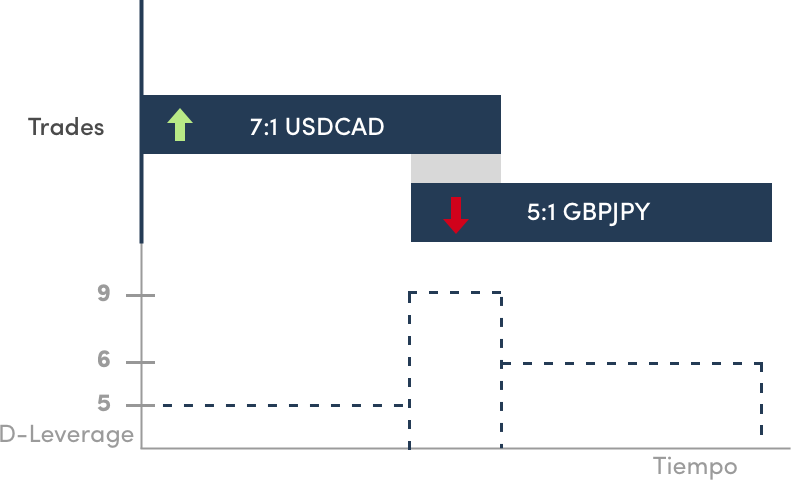
You can see that the D-Leverage has changed its value across the 3 positions in the following way:
-
Position nº1 => In this phase there is only one trade open long on the USDCAD, with a nominal leverage of 7:1. However, as in our example, the EURUSD is 40% more volatile than the USDCAD, so the position's D-Leverage will be 5.
-
Position nº2 => This position is made of two trades with different leverage and volatility. To simplify the calculation, let's suppose that the sum of both leverages adjusted to the volatility of the EURUSD, and taking into account the correlation of a long trade on the USDCAD and another short trade on the GBPJPY, D-Leverage is 9.
-
Position nº3 => Lastly, there is only one short trade open on the GBPJPY in the third position with a D-Leverage of 6, since it is 20% more volatile than the EUUSD.
The value of the D-Leverage has changed over this 3 positions based on nominal leverage, volatility and the correlation between all the assets open simultaneously.
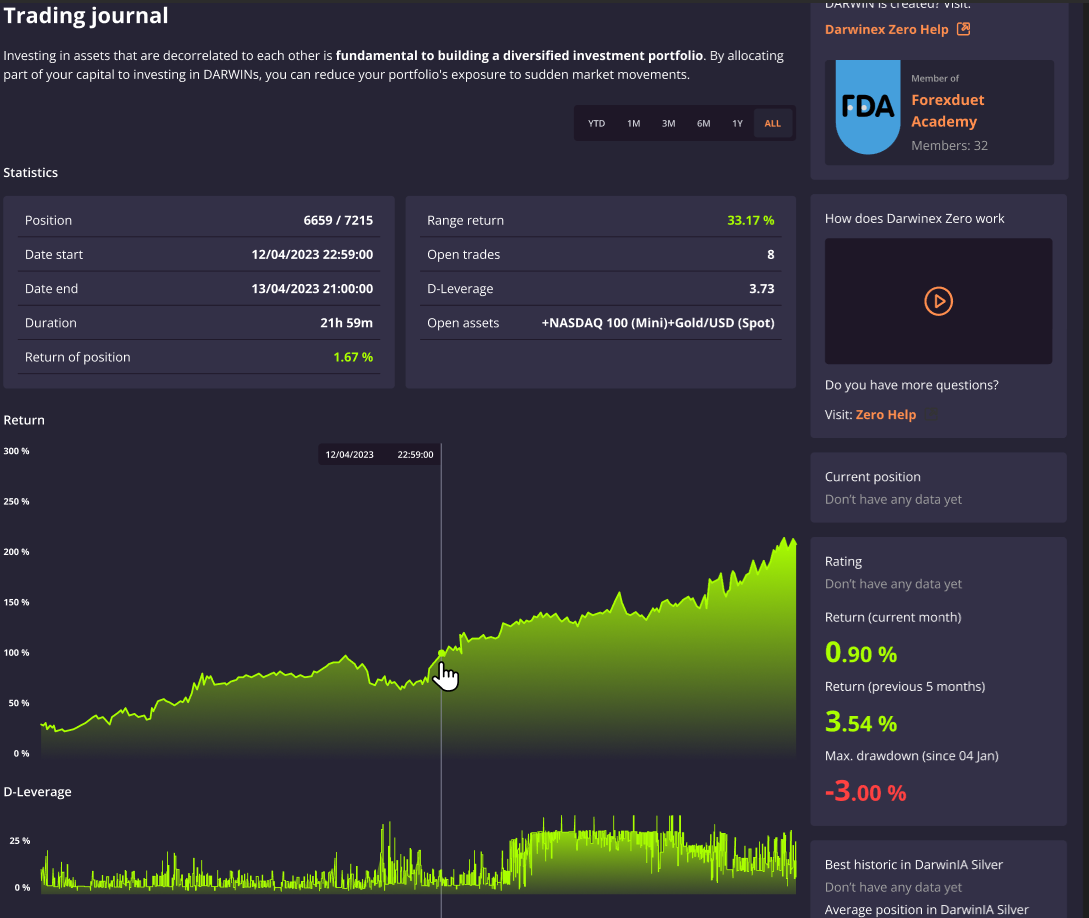
D-Leverage chart
In the ''trading journal'' tab, you will be able to analyze the progress of a strategy's return, together with the D-Leverage and the number of trades opened simultaneously on each position.