So analysierst du DARWIN Live-Trades
- 18 Jun 2024
- 1 Minute zum Lesen
So analysierst du DARWIN Live-Trades
- Aktualisiert am 18 Jun 2024
- 1 Minute zum Lesen
Artikel-Zusammenfassung
Fanden Sie diese Zusammenfassung hilfreich?
Vielen Dank für Ihr Feedback
Unten links auf dem Bildschirm findest du eine kleine Tabelle mit dem Namen DARWIN Live Trades. Du kannst die Tabelle maximieren, um die Informationen hier zu sehen:
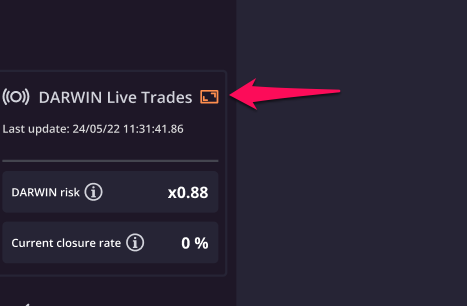
Wie sind das DARWIN Risiko und die aktuelle Abschlussrate zu interpretieren?
Das DARWIN-Risiko ist der Multiplikator, den das System verwendet, um die Nachbildung jedes Handels im DARWINzu erzeugen. Ein Multiplikator von 0,88 bedeutet zum Beispiel, dass das DARWIN für jede Einheit des Handelsvolumens auf dem Signalkonto das 0,88-fache des Handelsvolumens auf dem signal account.
Die Risiko-Engine kann jedoch eine zusätzliche Anpassung auf eine Position anwenden, die sich in der aktuellen Schließungsrate widerspiegelt, so dass die eröffneten DARWIN-Positionen das Ergebnis der folgenden Formel sind:
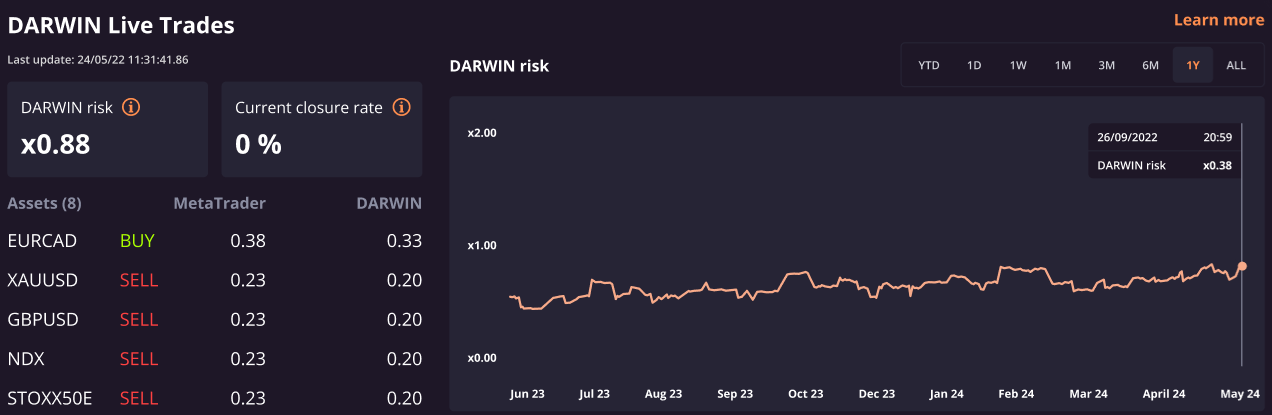
Wenn du die Tabelle vergrößerst, findest du jede Handelsreplikation auf dem DARWIN und eine Grafik, die die Entwicklung des DARWIN-Risikos zeigt:
War dieser Artikel hilfreich?