Drawdown calculation method
- 05 Apr 2023
- 2 Minutes to read
Drawdown calculation method
- Updated on 05 Apr 2023
- 2 Minutes to read
Article summary
Did you find this summary helpful?
Thank you for your feedback!
What is it?
A drawdown refers to a decrease or decline.
Applied to financial markets it is the series of accumulated losses in a given period or a peak-to-trough decline in the return curve.
While the drawdown has significant limitations when it comes to measuring the risk of a financial asset - at Darwinex we use Value-at-Risk (VaR) to measure risk- it is useful in that it gives a snapshot allowing us to see the maximum loss suffered in a given period versus the return obtained.
Drawdown shows what has happened in the past while VaR shows what could happen in the future with a given probability.
How is it calculated?
To calculate the drawdown for a historic time series, we first calculate the distance from peak to trough in the asset's return curve as illustrated in the image below.
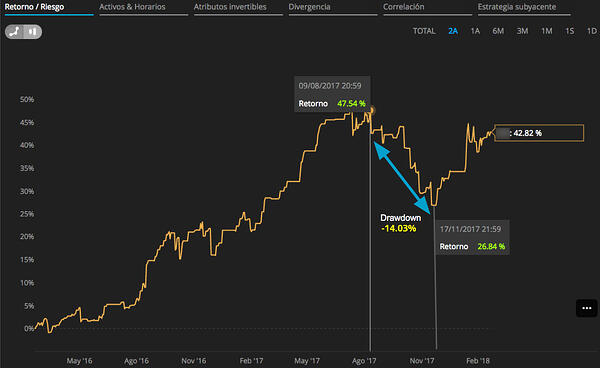
Drawdown
Here we can see that, over the course of 2 years, the DARWIN obtained a maximum return of 47.54%.
This "peak" return was achieved on 9th August 2017.
Subsequent to this peak, the DARWIN suffered a sustained period of losses over more than 2 months through 17th November 2017, at which point the total accumulated return was 26.84%.
This marks our "trough".
To obtain the drawdown we do the following calculation:
[((1+0.2684)-(1+0.4754))/(1+0.4754)]*100 = -14.03%.
What does this mean?
Someone who had invested at the beginning of the time series would have achieved a total return of 42.82%, suffering a maximum drawdown of 14.03%.
This gives a Return/Drawdown ratio of 3.05.
The maximum drawdown period will not finish until the total return is once again above the "peak" (47.54% in our example).
As such, this DARWIN on our example is still within its maximum drawdown period.
Where can I find it?
Drawdown information for can be found in two different places:
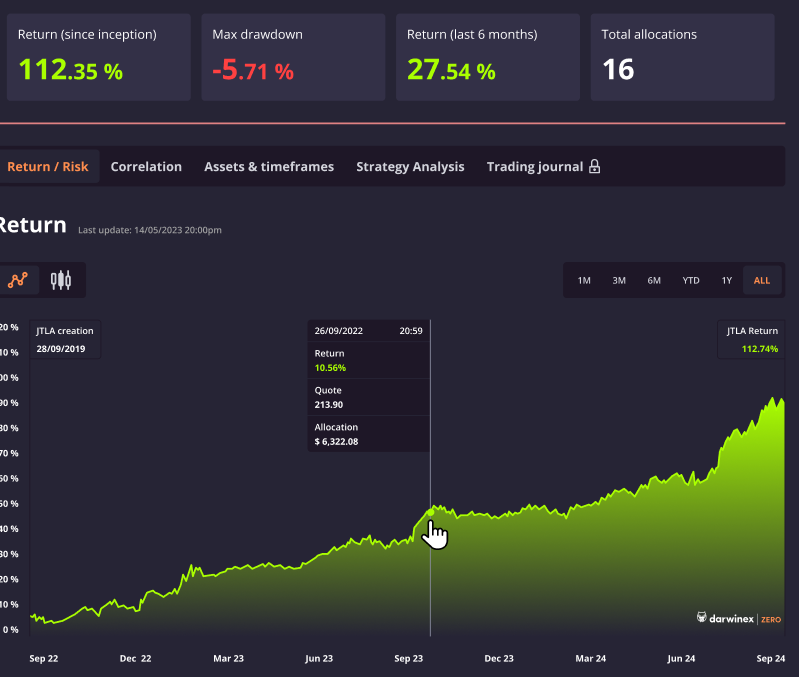
- Information related to the maximum drawdown since the very start of the strategy, along with the other most relevant statistics, can be found in the table at the top of the DARWIN or strategy profile.:
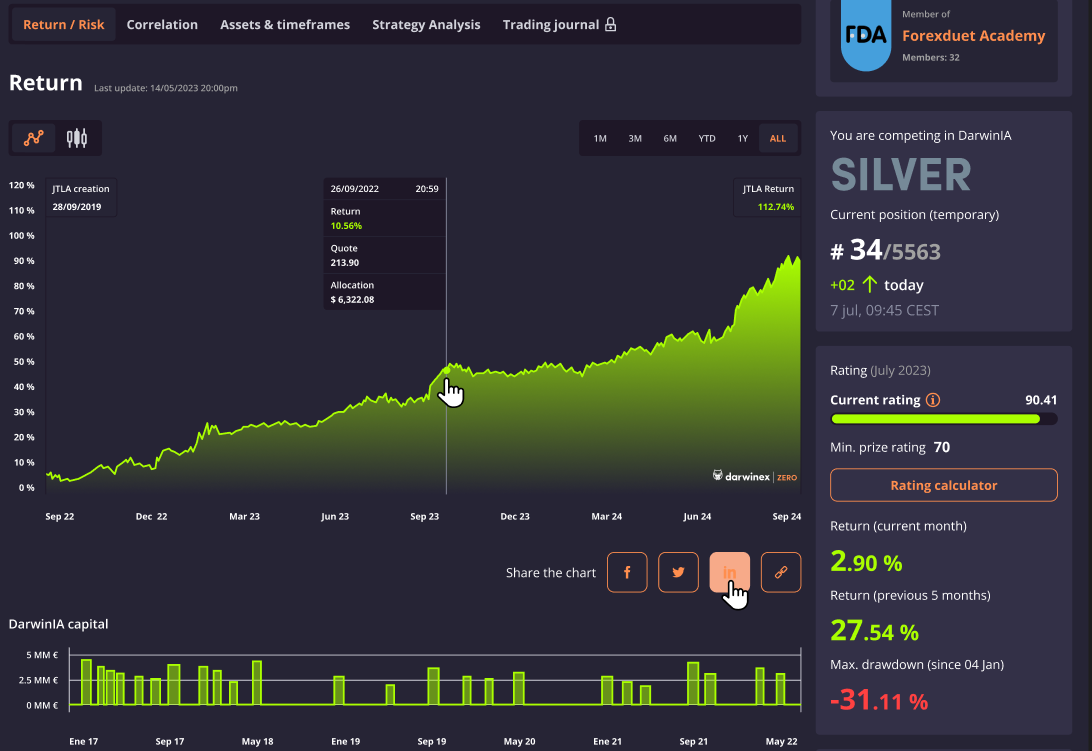
- Maximum drawdown for a given period fluctuates in accordance with the time period selected on the Return/Risk tab within the DARWIN page and can be seen to the right of the return graph.
Data used to calculate drawdown
The source data used to calculate the drawdown is the DARWIN's historic quote data, which is updated every 30 seconds.
Therefore, the calculated drawdown is measured based on the DARWIN quote points with a 30-second update.
Was this article helpful?