How to analyze Risk / Return
- 21 Sep 2023
- 3 Minutes to read
How to analyze Risk / Return
- Updated on 21 Sep 2023
- 3 Minutes to read
Article summary
Did you find this summary helpful?
Thank you for your feedback!
Return / Risk is the initial tab of "My DARWIN" and the one that displays the relevant information about your DARWIN performance: historical chart, key metrics and ratios, performance and drawdown distribution, etc.
Let´s see what information is available.
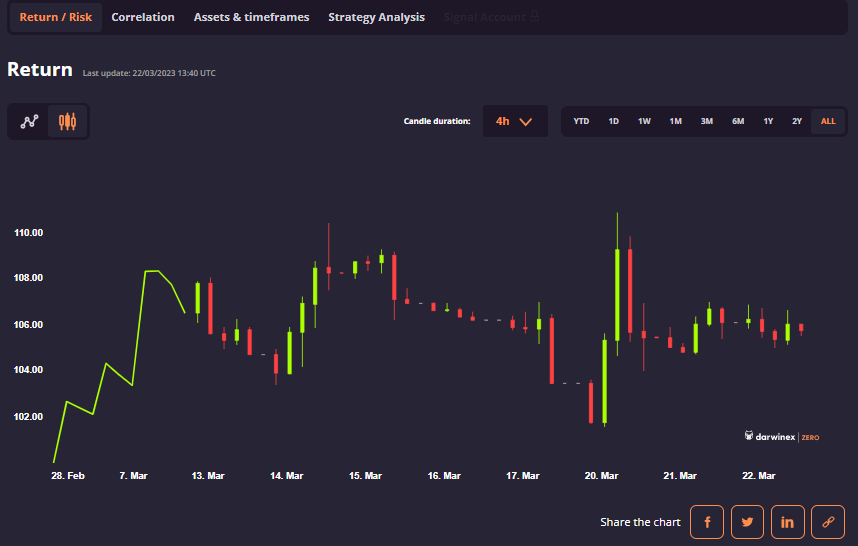
Performance chart
The first information available in this section is the performance graph of the DARWIN. You can switch timestamps and scroll over the graph to select a desired period. In addition, it is possible to switch to candle chart:
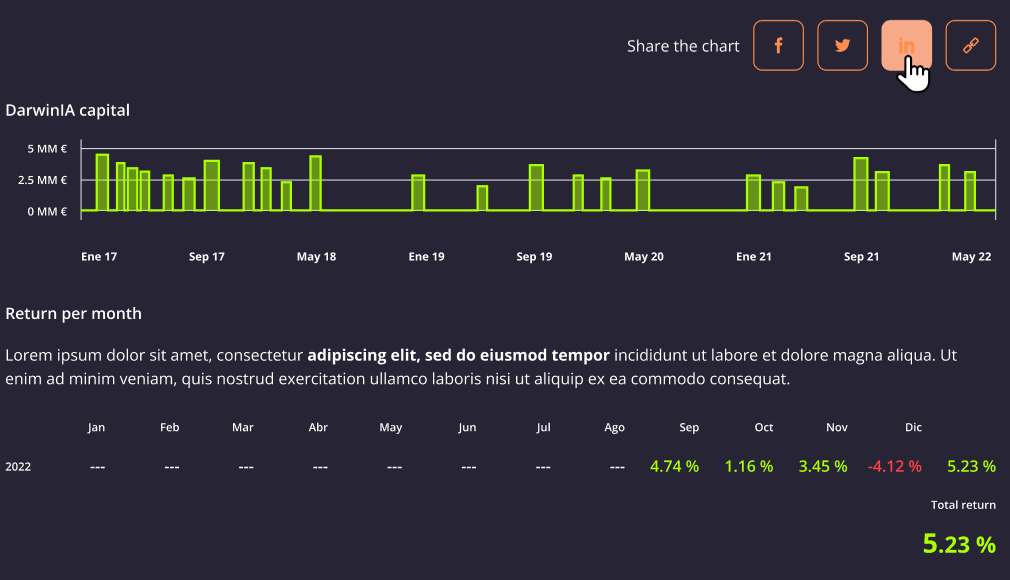
Right below the graph you have different links and options to share information about your DARWIN in social media (Facebook, Twitter, LinkedIN, etc.), a chart distribution about the different allocations received per month, and a monthly return table.
Statistics
If you continue scrolling down, you will find a table of different statistics and ratios providing information about the DARWIN performance:
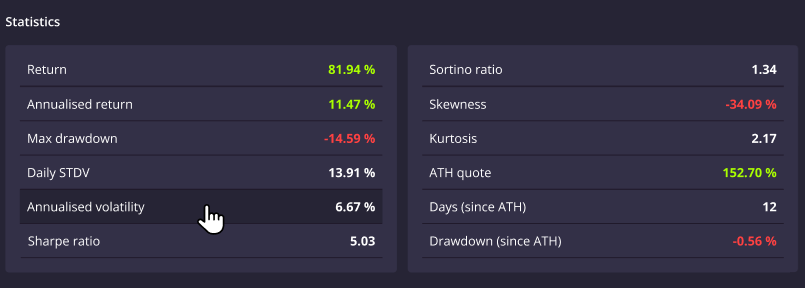
Return: Total DARWIN return since inception.
Annualised return: Expresses DARWIN's return in annualised terms. The formula is:
, where "n" is the number of years accumulated.
For example, a 20% return in 6 months would equal=44% annualised return. Max. drawdown: The maximum peak-to-trough decline in return experienced.
Daily STDV: Daily standard deviation. Standard deviation is a statistic that measures the dispersion of a dataset relative to its mean and is calculated as the square root of the variance. If the data points are further from the mean, there is a higher deviation within the data set; thus, the more spread out the data, the higher the standard deviation.
Annualised volatility: To present this volatility in annualized terms, the daily STDV is multiplied by the square root of 252, assuming there are 252 trading days in a given year.
Sharpe ratio: It compares the return of the DARWIN with its risk. It's a mathematical expression of the insight that excess returns over a period of time may signify more volatility and risk, rather than investing skill. The formula is:
The higher the Sharpe ratio, the more return is providing an investment compared to the risk involved in it.Sortino ratio: The Sortino ratio is a variation of the Sharpe ratio that only considers the standard deviation of negative returns. The formula is:
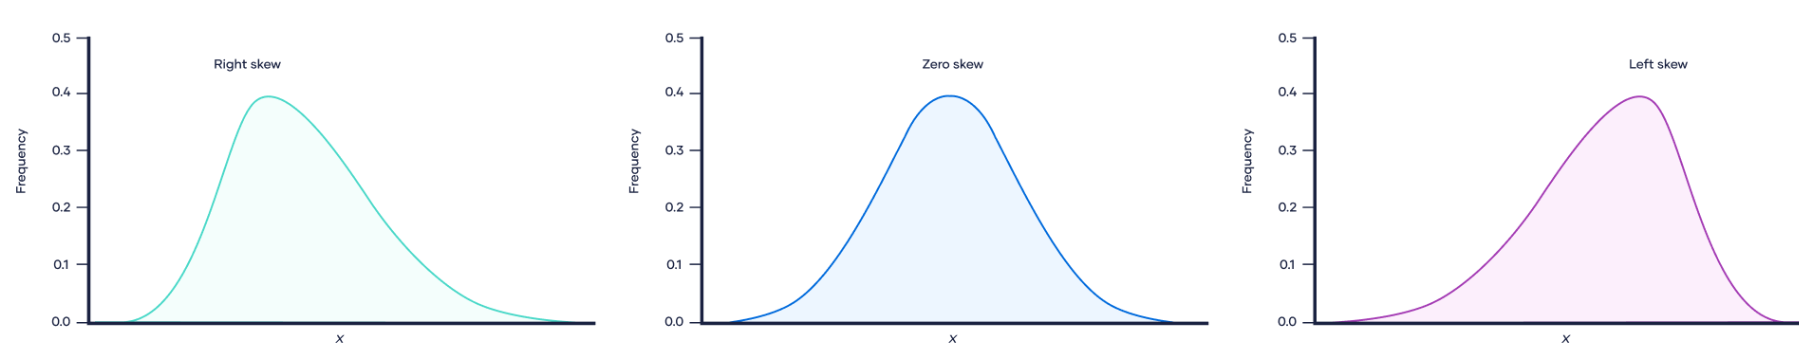
Skewness: Skewness is a measurement of the distortion of symmetrical distribution or asymmetry in a data set. Skewness is demonstrated on a bell curve when data points are not distributed symmetrically to the left and right sides of the median on a bell curve. Distributions can exhibit right (positive) skewness or left (negative) skewness to varying degrees. A normal distribution (bell curve) exhibits zero skewness.
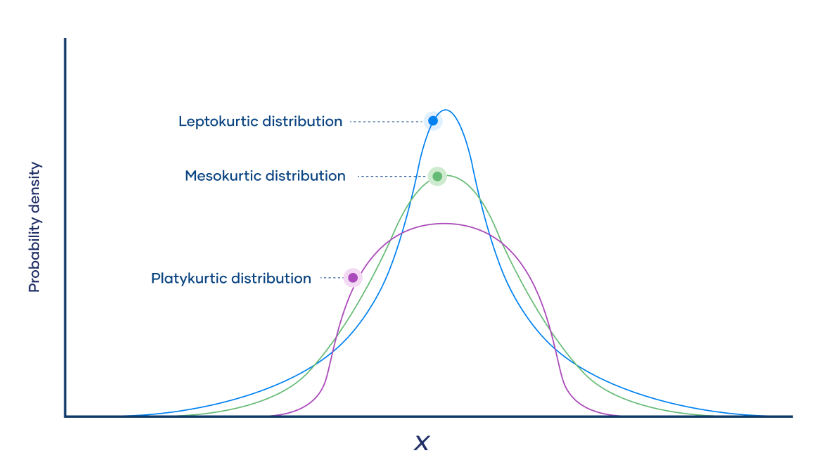
- Kurtosis: Kurtosis describes the "fatness" of the tails found in probability distributions. There are three categories of kurtosis: mesokurtic (=3), leptokurtic (>3), and platykurtic (<3). The lower the kurtosis, the less outlier values the sample has, which means there is less risk as there are fewer extreme values.
- ATH quote: All Time High DARWIN quote.
- Days (Since ATH): Number of days since All Time High quote.
- Drawdown (since ATH): Current peak-to-trough return since All Time High quote.
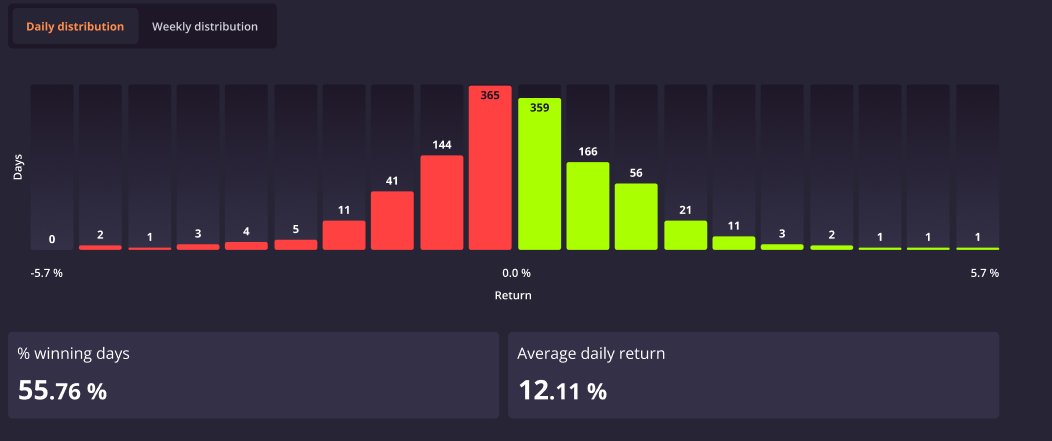
Return distribution
You can view a distribution of both daily and weekly return of your DARWIN, along with the percentage of winning days and the average daily return. It may be useful to analyze the kurtosis and skewness by looking at the performance distribution.
Best and worst moments
In this table the best and worst performance moments are displayed with the option to switch between days, weeks and months.
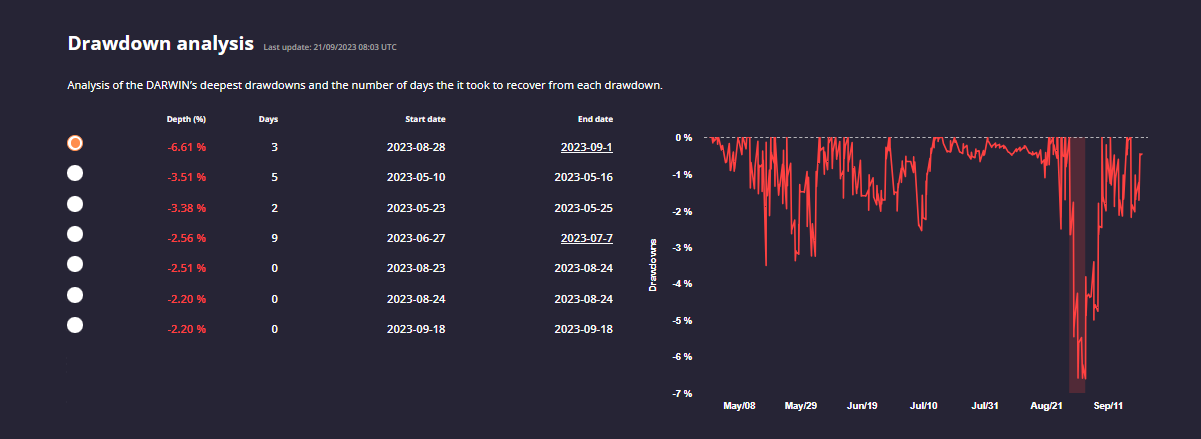
Drawdown analysis
The last analysis available in this section is the Drawdown analysis. It displays a table showing the biggest drawdowns and the number of days from peak to trough, along with chart that shows the DARWIN drawdown on a daily basis.
Was this article helpful?