How to analyze your Trading Journal
- 05 Apr 2023
- 1 Minute to read
How to analyze your Trading Journal
- Updated on 05 Apr 2023
- 1 Minute to read
Article summary
Did you find this summary helpful?
Thank you for your feedback!
The Trading Journal offers a very useful overview of a trader's trading style via an analysis of their historic operations.
It is important because an ability to understand it means that you will be able to identify certain risky strategies, like martingales, at a glance.
Below we detail the information you can find within the Trading Journal.
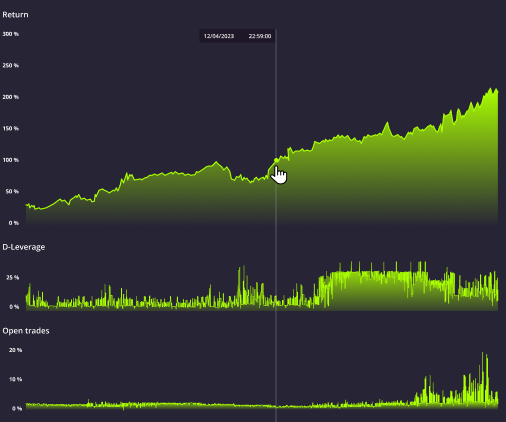
1. Return
A graph showing the equity curve of the underlying strategy.
2. Risk
A graph showing the D-Leverage involved in every position of the underlying strategy
3. Open trades
A graph in which you can see the number of simultaneously open trades that in aggregate form a position.
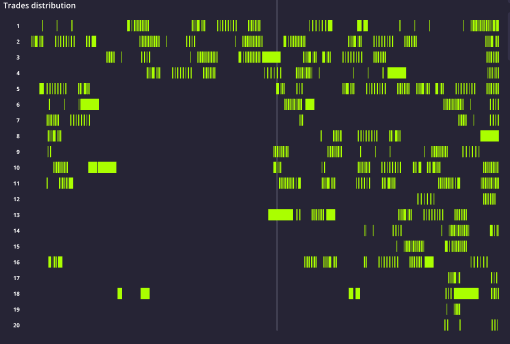
4. Trade distribution
A visual representation of horizontal bars showing the totality of trades the strategy opened that specifies the underlying asset traded, the length of time the trade was open, and the date of open and close.
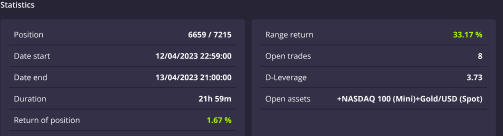
In addition to the graphs, the Trading Journal has a column on the top side containing detailed information specific to a given position.
By moving your mouse over a position on the graph, this information will automatically update with information specific to the position in question.
Was this article helpful?