
The Assets & Timeframes tab displays key information about your DARWIN's asset allocation, trading time distribution, and return distribution by day of the week.
Asset allocation
This section shows a pie chart where you can see the percentage of trades you have made in each different asset. You can view the information both by asset and by asset family (forex, commodities, indices, stocks or ETFs).
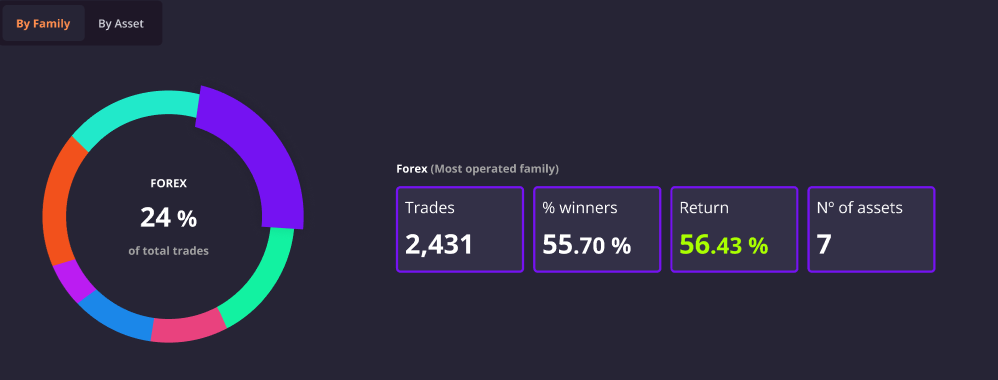
Additionally, you will find information about how many trades have been executed, the percentage of winning trades, and the return accumulated per asset.
Trading time distribution
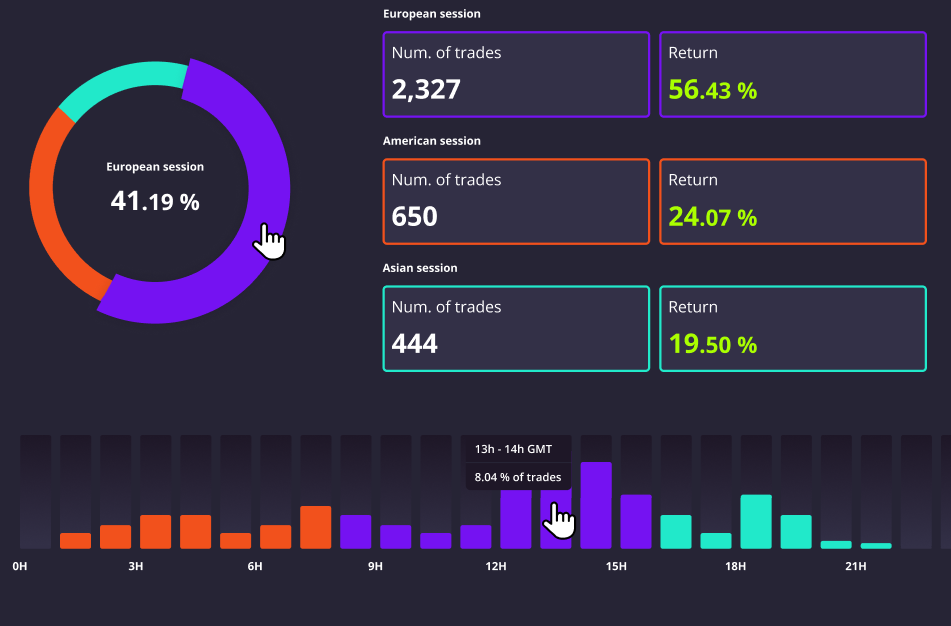
In this section you can see a similar pie chart where you can review the time distribution of your trades between Asian (00:00–09:00 GMT), European (09:00–16:00 GMT), and American (16:00–00:00 GMT) sessions, as well as analyze the number of trades in each session and the accumulated return in each one of them.
Return distribution by day of the week
The chart shows the accumulated return generated by your DARWIN for each day of the week. Look for patterns such as consistently strong or weak performance on specific days, as these can reveal structural biases in your strategy's timing. Below, you can see the number of days with trading activity for each day of the week.
Analyzing the information
Use this section to identify which assets and timeframes have generated the most returns in your strategy, and to make informed decisions about optimizing or adjusting your approach going forward.