
What is DARWIN Live Trades?
DARWIN Live Trades is a panel at the bottom left of the trading screen that displays each open position on the DARWIN, the current DARWIN VaR, the DARWIN risk multiplier, and the current closure rate for every active trade.
You can find the DARWIN Live Trades table at the bottom left of the screen. You can maximise the table to see the information here:
You can maximise the table to see the information here: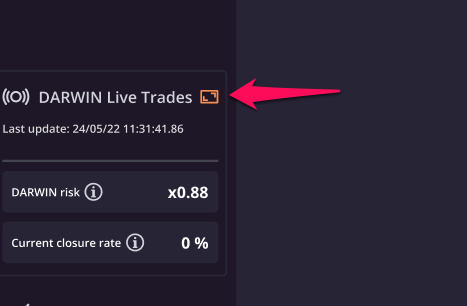
How to interpret DARWIN risk and current closure rate?
The DARWIN risk is the multiplier that the system uses to generate the replica of each trade in the DARWIN. A multiplier of 0.88, for example, means that, for each unit of volume traded on the signal account, the DARWIN will mirror that trade with 0.88 times the volume traded on the signal account.
However, the risk engine may apply an additional adjustment on a position that will be reflected in the current closure rate, so that the DARWIN positions opened will be a result of the following formula:
DARWIN volume = Signal account volume × DARWIN risk × Current closure rate
If you maximize the table, you will be able to find each trade replica on the DARWIN, the current DARWIN's VaR and a chart showing the evolution of the DARWIN risk:

Minor discrepancies in displayed values may occur when markets are closed.