Strategy statistics
There are many statistics regarding the strategy. Let's explain the meaning of them:
- Trades: Number of total trades.
- % algorithmic trades: Number of trades that have been carried out algorithmically out of the total number of trades.
- % long exposure: Percentage of trades opened long (buy side) over total trades.
- Median duration: The middle value of the data set: 50% of data points are smaller or equal to the median, and 50% are higher or equal to the median. Measured in hours.
- Frequency: Number of average trades per day.
- % winning: Average of trades with positive return over total trades.
- Profit factor: Total gross profits divided by the total gross loss (including commissions) for the entire trading period.
- Average winning trade: Average positive result per trade on winning trades.
- Average losing trade: Average negative result per trade on losing trades.
- Payoff ratio: Average profit on winning trades divided by average loss on losing trades.
- Average winning trade duration: Average duration (in hours) of trades with positive return.
- Average losing trade duration: Average duration (in hours) of trades with negative return.
- Duration ratio: Average winning trade duration divided by the average losing trade duration.
- % in the market: Number of hours the strategy has open trades divided by the total hours of open markets.
Duration vs Profit (by trade)
In this section you will see a distribution matrix where the X-axis is the return per trade measured in pips, while the Y-axis reflects the duration of each trade.
In this sense, the matrix shows for each point the information about the duration of each trade and the pips of profit or loss.
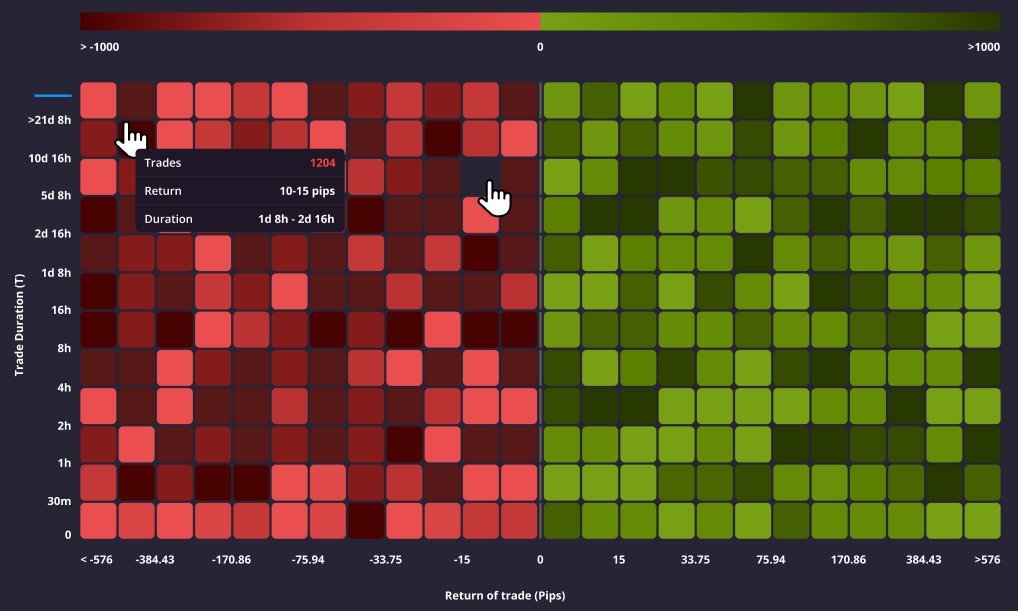
This information can be useful to analyse the homogeneity or heterogeneity of the duration of your trades and the profit or loss on them. If the bulk of your trades are close on the X-axis, it means that you have a defined system of closing positions based on the profitability obtained, while the more similar the trades are on the Y-axis, the more stable the duration of your trades, and viceversa. In summary, it shows consistency in both duration and returns.
Max. Positive/negative excursion per position
The chart evaluates whether a trading strategy exhibits symmetric behaviour independently of whether a position is winning or losing.
A common pattern is the inability to close losing positions — often accumulating significant losses in anticipation of a market reversal — combined with premature closure of winning positions before full profit potential is realised.
In this graph you can see all historic trades over the course of a trading strategy's life.
Plotted on the Y-Axis we can see the % return related to the position:
- Maximum negative excursion: The depth of the red bars indicates the maximum unrealised percentage loss incurred in an open position in a given asset.
- Maximum positive excursion: The height of the green bars indicates the maximum unrealised percentage gain incurred in an open position in a given asset.
- Actual position close level: Within the red or green bar for a given position, the black horizontal line delimits the position at which the position was actually closed and therefore represents the percentage realized return of the position.
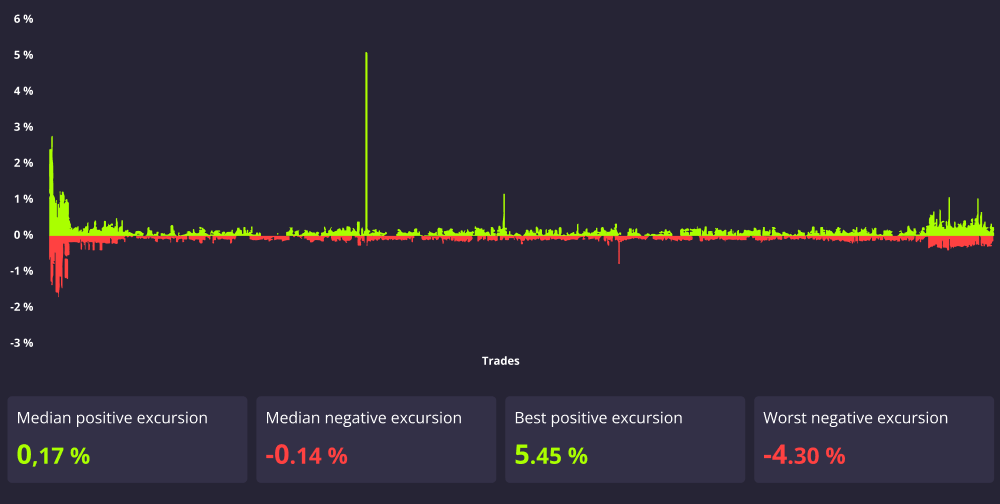
A strategy demonstrates stronger loss-aversion discipline when positive excursions (green bars) consistently exceed negative excursions (red bars) in magnitude.
Signal account risk management
Signal account risk management shows how the Darwinex Zero Risk Engine manages VaR for the underlying strategy. The Risk Engine transforms the strategy into a DARWIN — with a 6.5% monthly target VaR (95% confidence level). To determine the DARWIN's target VaR (which can oscillate between 3.25% and 6.5%), the risk engine analyses the VaR of the signal account during the last 6 months (refer to How does the risk engine work? for the current look-back period), as explained in How does the risk engine work?
The more stable the underlying strategy's risk, the easier it is for the Risk Manager to faithfully replicate the Underlying Strategy and the closer the monthly VaR of the DARWIN will be to the maximum 6.5%.
The graph shows the VaR of the signal account during the selected period.
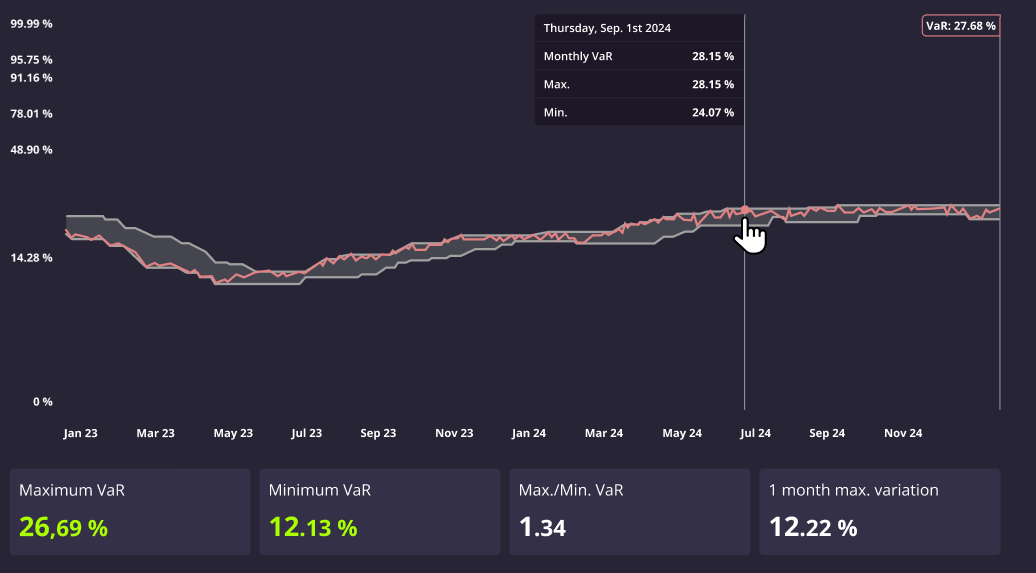
In order to better visualise the risk, there is a shaded area with three lines:
- The upper line shows the maximum VaR in the last 45 trading days at a given point for which positions were opened.
- The lower line shows the minimum VaR in the last 45 trading days at a given point for which positions were opened.
- The centre, coloured line, shows the actual level of VaR at a given point in time.
The vertical axis of the graphs is shown with a logarithmic scale.
Relationship between the DARWIN and its signal account
- If the VaR of the signal account is greater than 6.5%, the DARWIN will win/lose less than the signal account in percentage terms.
- If the VaR of the signal account is less than 6.5%, the DARWIN will tend to win/lose more than the signal account in percentage terms (note DARWIN's VaR may oscilate between 3.25% and 6.5%).
For further information on the differences between a DARWIN and its signal account check this article.
You can check the live relationship between the signal account and the DARWIN's replica in DARWIN live trades.
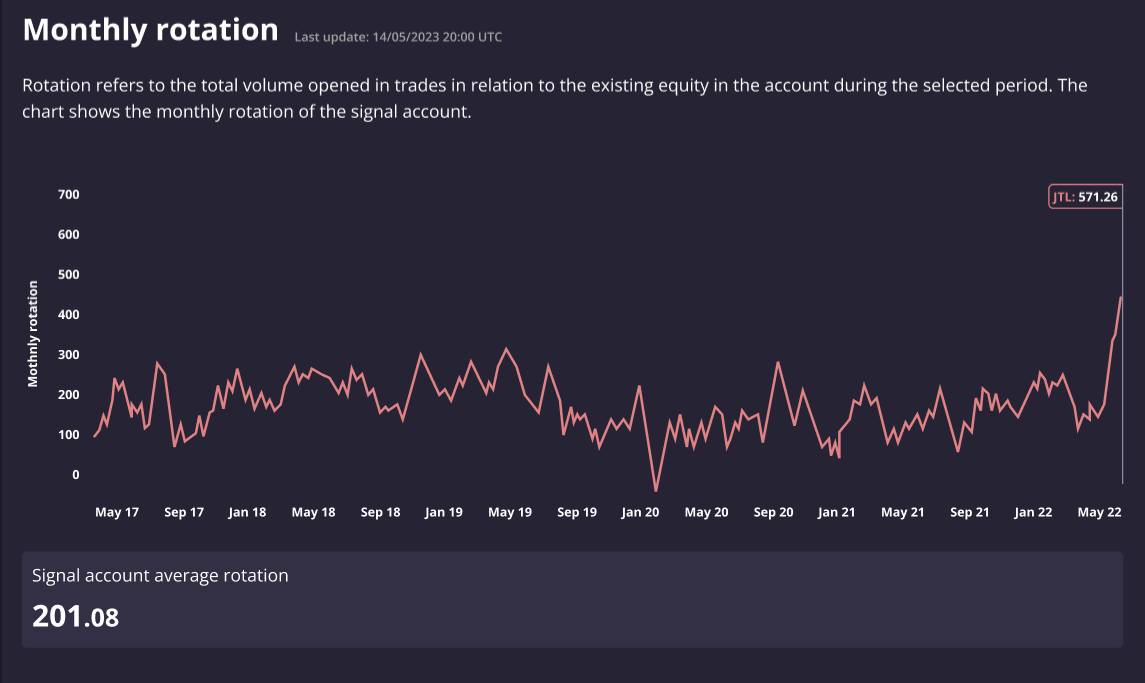
Monthly rotation
Rotation refers to the total volume opened in trades during a given period of time.
For example, if a trading account's equity is 100,000$, and the total lots traded within a month is 5 lots in USDJPY (which equals 500,000USD), then the monthly rotation would be 5.
The chart shows the monthly rotation of the signal account: